Basic diamond plot construction function
This function constructs a diamond plot using ggDiamondLayer. It's normally not necessary to call this function directly: instead, use meansDiamondPlot, meanSDtoDiamondPlot, and factorLoadingDiamondCIplot.
diamondPlot(data, ciCols = 1:3,
            colorCol = NULL, otherAxisCol = NULL,
            yValues = NULL, yLabels = NULL,
            ylab = NULL, autoSize = NULL,
            fixedSize = 0.15,
            xlab = "Effect Size Estimate",
            theme = theme_bw(),
            color = "black",
            returnLayerOnly = FALSE,
            outputFile = NULL,
            outputWidth = 10,
            outputHeight = 10,
            ggsaveParams = list(units='cm',
                                dpi=300,
                                type="cairo"),
            ...)
Arguments
| data | A dataframe (or matrix) containing lower bounds, centers (e.g. means), and upper bounds of intervals (e.g. confidence intervals). |
|---|---|
| ciCols | The columns in the dataframe with the lower bounds, centers (e.g. means), and upper bounds (in that order). |
| colorCol | The column in the dataframe containing the colors for each diamond, or a vector with colors (with as many elements as the dataframe has rows). |
| otherAxisCol | The column in the dataframe containing the values that
determine where on the Y axis the diamond should be
placed. If this is not available in the dataframe,
specify it manually using |
| yValues | The values that determine where on the Y axis the diamond should be
placed (can also be a column in the dataframe; in that case,
use |
| yLabels | The labels to use for for each diamond (placed on the Y axis). |
| xlab, ylab | The labels of the X and Y axes. |
| autoSize | Whether to make the height of each diamond conditional upon its length (the width of the confidence interval). |
| fixedSize | If not using relative heights, |
| theme | The theme to use. |
| color | Color to use if colors are specified for each diamond. |
| returnLayerOnly | Set this to TRUE to only return the |
| outputFile | A file to which to save the plot. |
| outputWidth, outputHeight | Width and height of saved plot (specified in centimeters by default, see |
| ggsaveParams | Parameters to pass to ggsave when saving the plot. |
| … | Additional arguments will be passed to |
Value
A ggplot plot with a ggDiamondLayer is returned.
See also
Examples
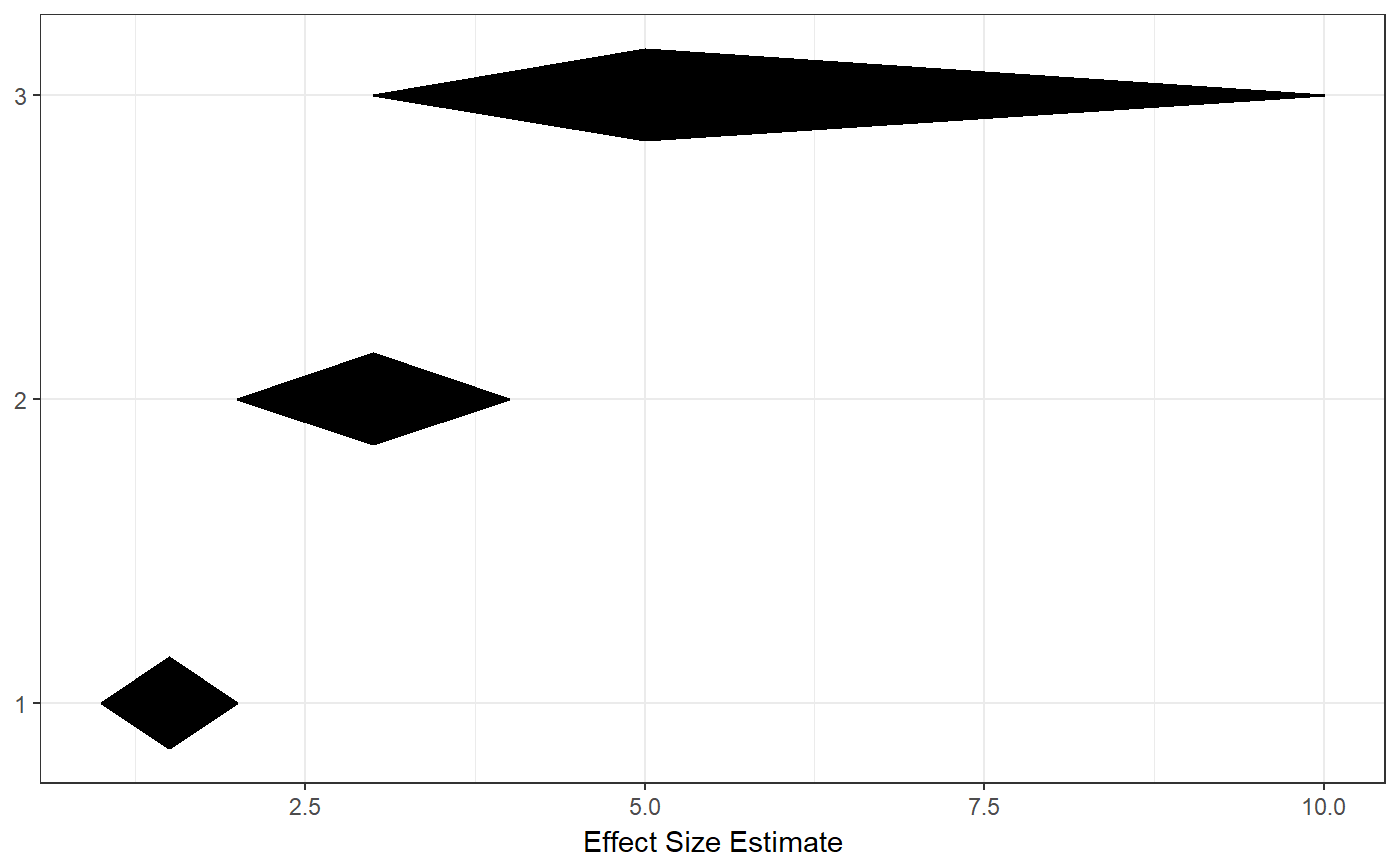
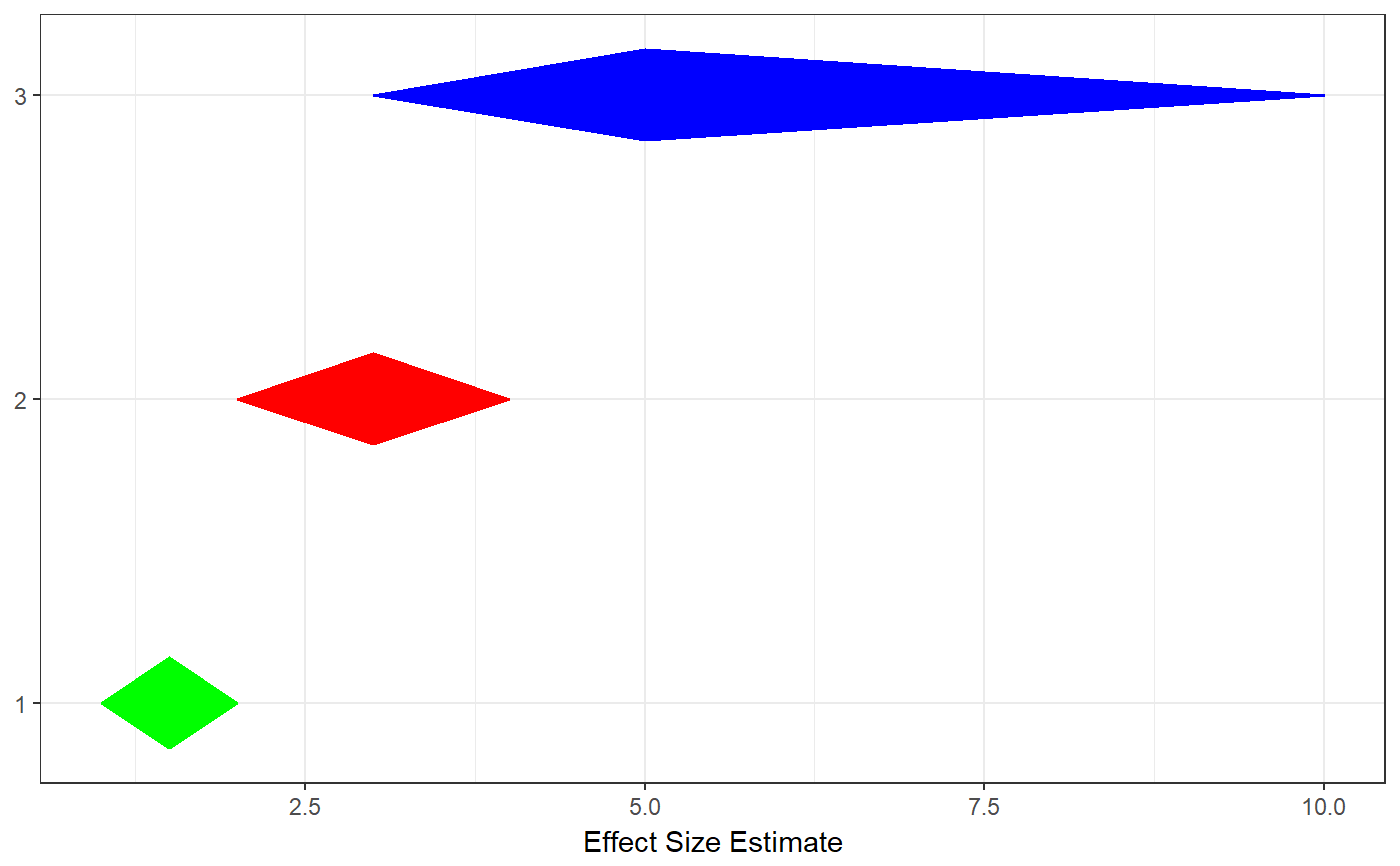
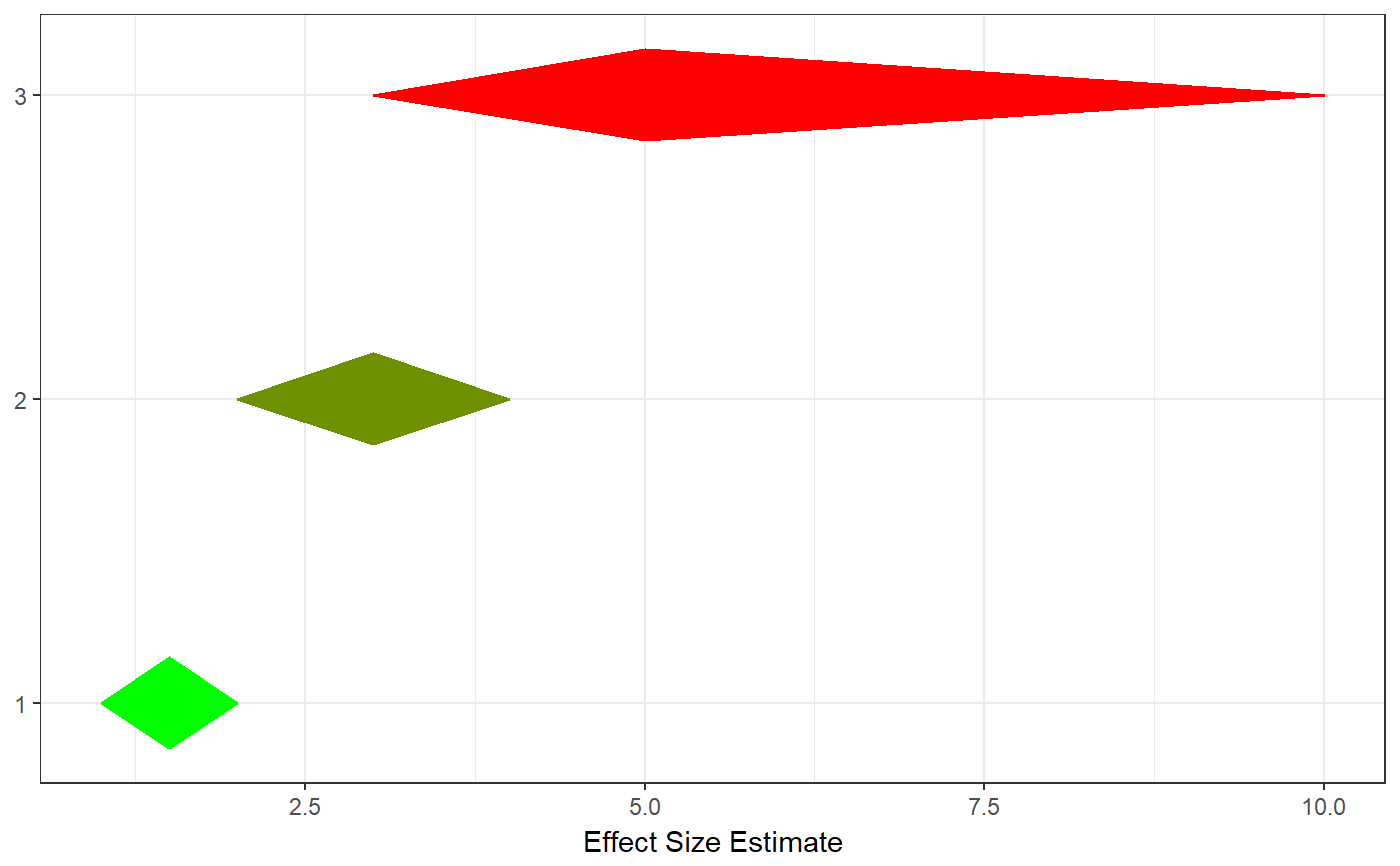
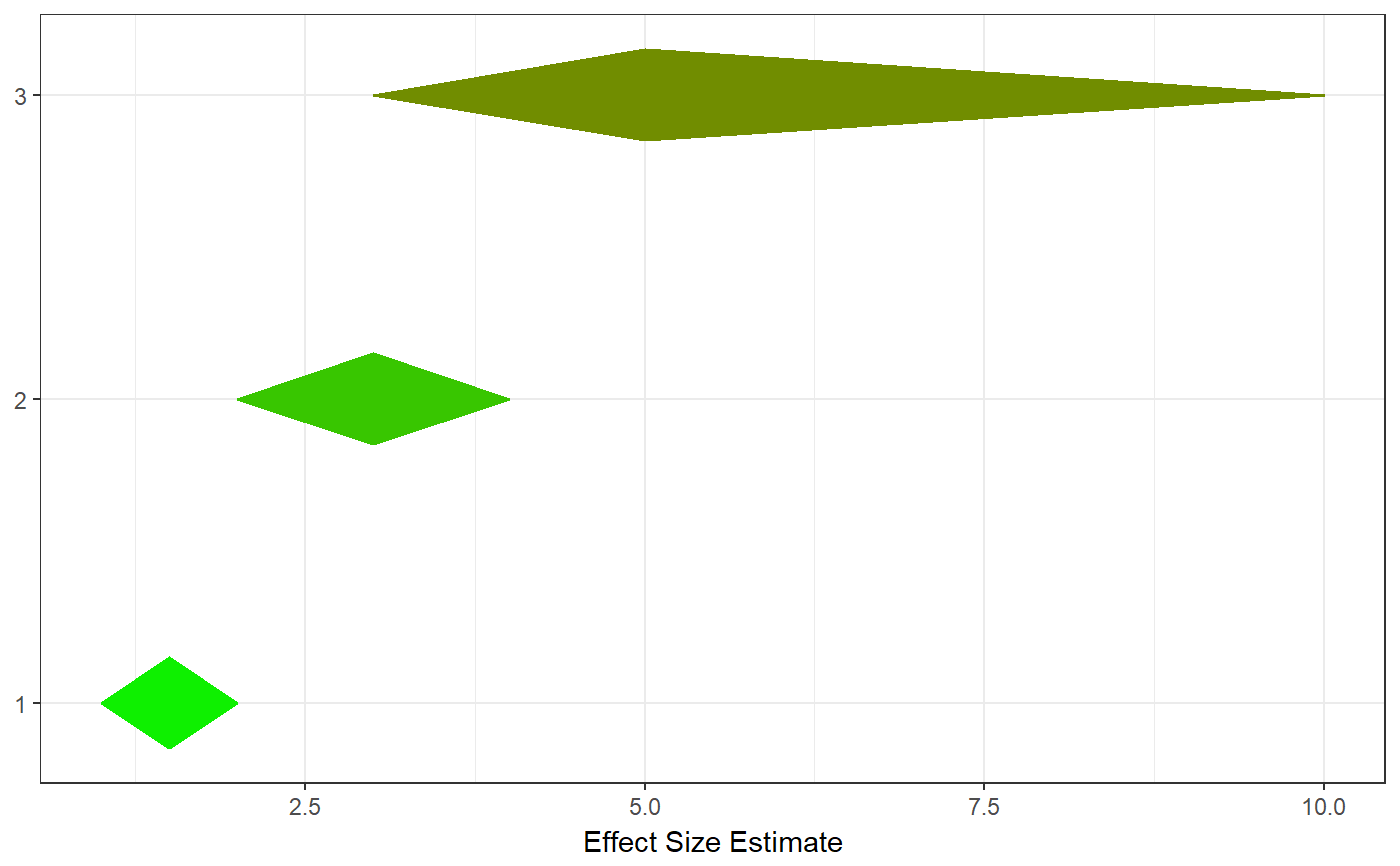
tmpDf <- data.frame(lo = c(1, 2, 3), mean = c(1.5, 3, 5), hi = c(2, 4, 10), color = c('green', 'red', 'blue')); ### A simple diamond plot diamondPlot(tmpDf);### A diamond plot using the specified colours diamondPlot(tmpDf, colorCol = 4);### A diamond plot using automatically generated colours ### using a gradient diamondPlot(tmpDf, generateColors=c('green', 'red'));### A diamond plot using automatically generated colours ### using a gradient, specifying the minimum and maximum ### possible values that can be attained diamondPlot(tmpDf, generateColors=c('green', 'red'), fullColorRange=c(1, 10));