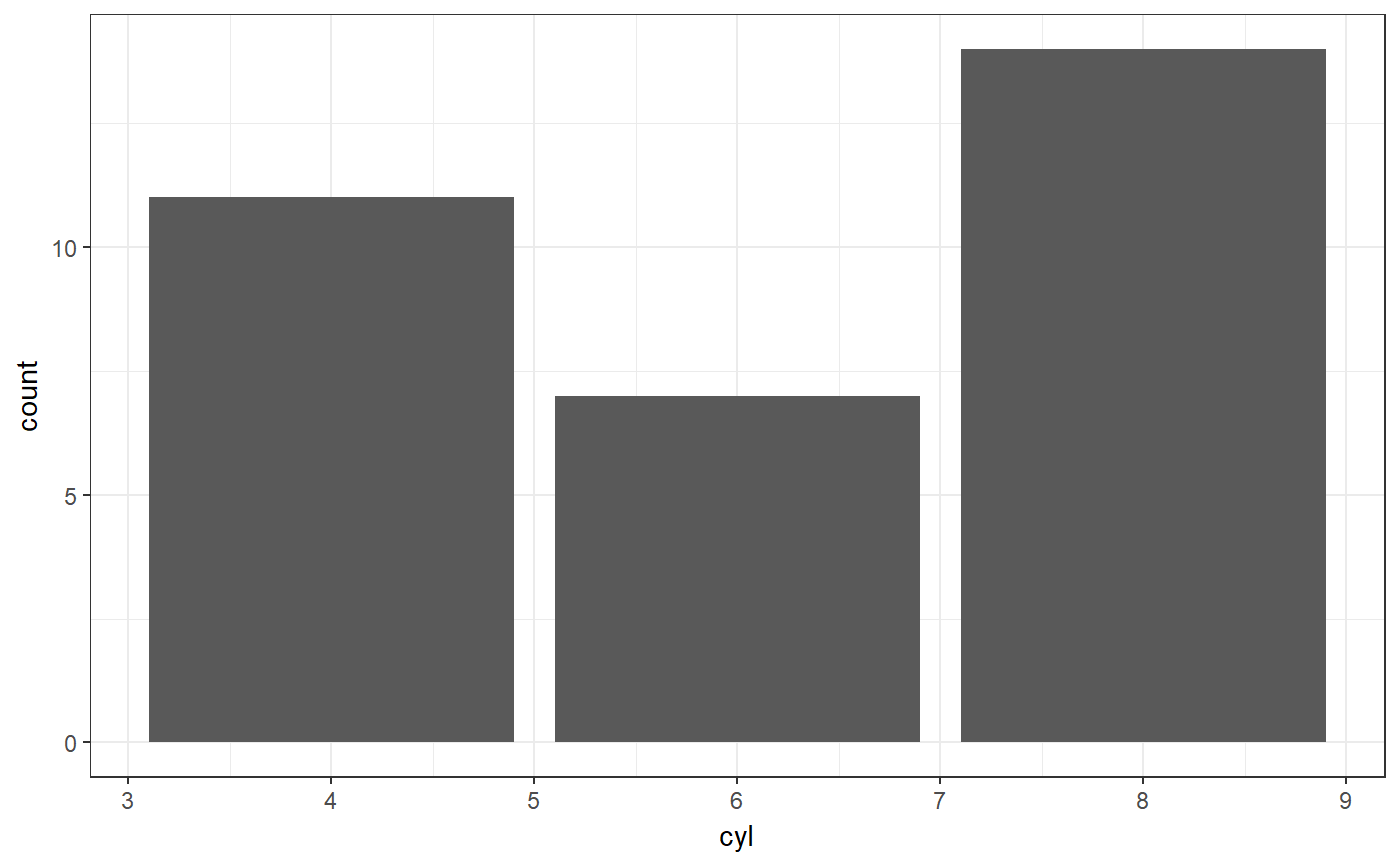
Bar chart using ggplot
This function provides a simple interface to create a ggplot bar chart.
ggBarChart(vector, plotTheme = theme_bw(), ...)
Arguments
| vector | The vector to display in the bar chart. |
|---|---|
| plotTheme | The theme to apply. |
| … | And additional arguments are passed to |
Value
A ggplot plot is returned.
See also
geom_bar
Examples
ggBarChart(mtcars$cyl);