Numbers Needed for Change
This function computes the Numbers Needed for Change, and shows a
visualisation to illustrate them. nnt is an alias for nnc.
nnc(d = NULL, cer = NULL, r = 1, n = NULL,
    threshold = NULL, mean = 0, sd = 1,
    poweredFor = NULL, thresholdSensitivity = NULL,
    eventDesirable = TRUE, eventIfHigher = TRUE,
    conf.level=.95,
    d.ci = NULL, cer.ci = NULL, r.ci = NULL,
    d.n = NULL, cer.n = NULL, r.n = NULL,
    plot = TRUE, returnPlot = TRUE, silent = FALSE)
Arguments
| d | The value of Cohen's d. |
|---|---|
| cer | The Control Event Rate. |
| r | The correlation between the determinant and behavior (for mediated Numbers Needed for Change). |
| n | The sample size. |
| threshold | If the event rate is not available, a threshold value can be specified
instead, which is then used in conjunction with the mean
( |
| mean | The mean value, used to draw the plot, or, if no CER is provided but instead the threshold value, to compute the CER. |
| sd | The standard deviation, used to draw the plot (and to compute the CER if a threshold value is supplied instead of the CER). |
| poweredFor | The Cohen's d value for which the study was powered. This expected Cohen's d value can be used to compute the threshold, which then in turn is used to compute the CER. To use this approach, also specify the mean and the standard deviation. |
| thresholdSensitivity | This argument can be used to provide a vector of potential threshold values, each of which is used to compute an NNC. This enables easy inspection of whether the value chosen as threshold matters much for the NNC. |
| eventDesirable | Whether an event is desirable or undesirable. |
| eventIfHigher | Whether scores above or below the threshold are considered 'an event'. |
| conf.level | The confidence level of the confidence interval. |
| d.ci | Instead of providing a point estimate for Cohen's d, a confidence interval can be provided. |
| cer.ci | Instead of providing a point estimate for the Control Event Rate, a confidence interval can be provided. |
| r.ci | Instead of providing a point estimate for the correlation, a confidence interval can be provided. |
| d.n | In addition to providing a point estimate for Cohen's d, a sample size can be provided; if it is, the confidence interval is computed. |
| cer.n | In addition to providing a point estimate for the Control Event Rate, a sample size can be provided; if it is, the confidence interval is computed. |
| r.n | In addition to providing a point estimate for the correlation, a sample size can be provided; if it is, the confidence interval is computed. |
| plot | Whether to generate and show the plot. |
| returnPlot | Whether to return the plot (as an attribute), or to only display it. |
| silent | Whether to suppress notifications. |
Details
This function computes the Numbers Needed for Change. See Gruijters & Peters (2017) for details.
Value
The Numbers Needed for Change (NNC), potentially with a plot visualising the NNC in an attribute.
References
Gruijters, S. L. K., & Peters, G.-J. Y. (2017). Introducing the Numbers Needed for Change (NNC): A practical measure of effect size for intervention research.
Examples
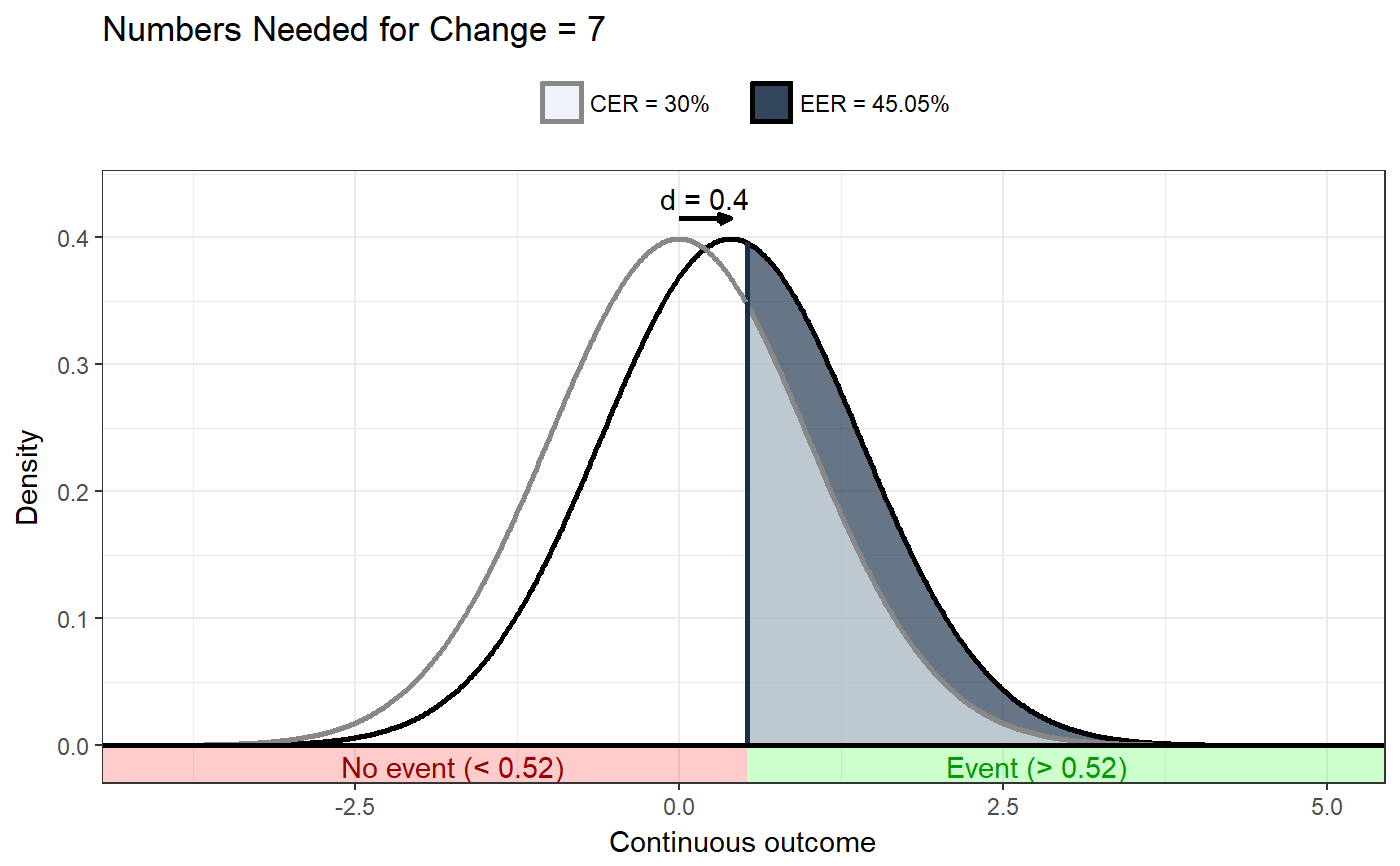
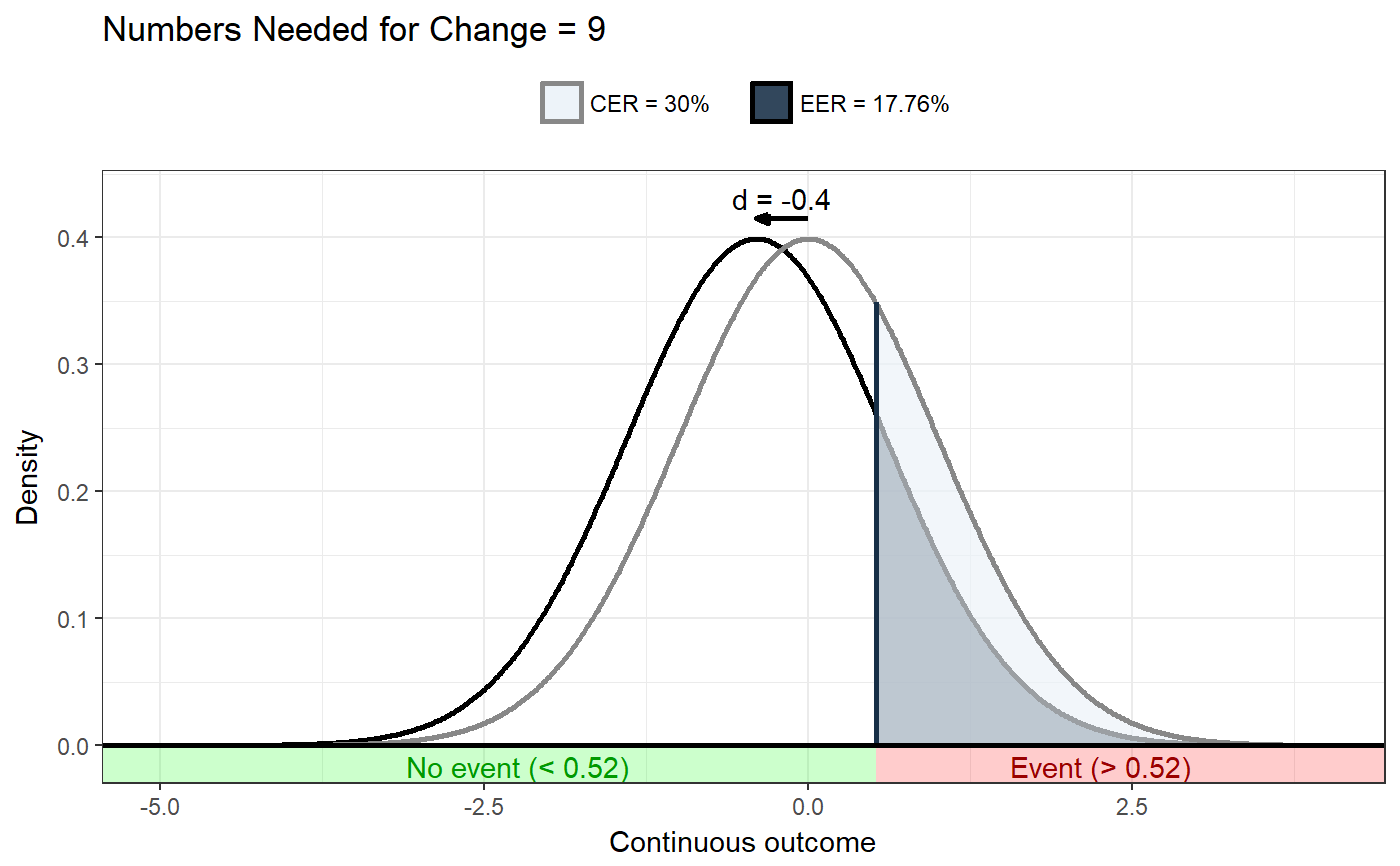
### Simple example nnc(d=.4, cer=.3);#> #> Numbers Needed for Change: 7 #> #> (Based on a Control Event Rate (CER) of .3, an Experimental Event Rate (EER) of .45 and a Cohen's d of 0.4.)### Or for a scenario where events are undesirable, and the ### intervention effective (therefore having a negative value for d): nnc(d=-.4, cer=.3, eventDesirable=FALSE);#> #> Numbers Needed for Change: 9 #> #> (Based on a Control Event Rate (CER) of .3, an Experimental Event Rate (EER) of .18 and a Cohen's d of -0.4.)